This site uses cookies to improve your experience. To help us insure we adhere to various privacy regulations, please select your country/region of residence. If you do not select a country, we will assume you are from the United States. Select your Cookie Settings or view our Privacy Policy and Terms of Use.
Cookie Settings
Cookies and similar technologies are used on this website for proper function of the website, for tracking performance analytics and for marketing purposes. We and some of our third-party providers may use cookie data for various purposes. Please review the cookie settings below and choose your preference.
Used for the proper function of the website
Used for monitoring website traffic and interactions
Cookie Settings
Cookies and similar technologies are used on this website for proper function of the website, for tracking performance analytics and for marketing purposes. We and some of our third-party providers may use cookie data for various purposes. Please review the cookie settings below and choose your preference.
Strictly Necessary: Used for the proper function of the website
Performance/Analytics: Used for monitoring website traffic and interactions
We have all been seeing the transformation of datascience from being used extensively in technical domains for analysis to being used as an excellent tool for solving social and global issues. This advanced application of datascience for humanitarian aid would bring us closer to society and change the world.
Introduction Classification algorithms are at the heart of datascience, helping us categorize and organize data into pre-defined classes. These algorithms are used in a wide array of applications, from spam detection and medical diagnosis to image recognition and customer profiling.
AI and datascience are advancing at a lightning-fast pace with new skills and applications popping up left and right. In this hands-on session, youll start with logistic regression and build up to categorical and ordered logistic models, applying them to real-world survey data.
Unlike deep learning, which struggles with sharp discontinuities in data, decision trees can model abrupt changes in relationships between variables. Lucena explained how random forests first introduced the power of ensembles, but gradient boosting takes it a step further by focusing on the residual errors from previous trees.
It easily handles a mix of categorical, ordinal, and continuous features. Yet, I haven’t seen a practical implementation tested on real data in dimensions higher than 3, combining both numerical and categorical features. All categorical features are jointly encoded using an efficient scheme (“smart encoding”).
In this post, I will discuss the common problems with existing solutions, explain why I am no longer a fan of Kaggle, propose a better solution, and outline a personalized prediction approach. As shown in the profile of the dataset, there are both integer and categorical features. There’re some interesting details in the data.
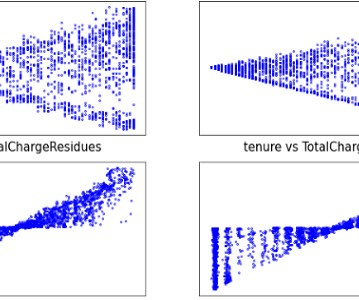
This article seeks to also explain fundamental topics in datascience such as EDA automation, pipelines, ROC-AUC curve (how results will be evaluated), and Principal Component Analysis in a simple way. You can find the application here and follow through with the discussion. Missing Values.
DataScience interviews are pivotal moments in the career trajectory of any aspiring data scientist. Having the knowledge about the datascience interview questions will help you crack the interview. DataScience skills that will help you excel professionally.
Demand forecasting, powered by datascience, helps predict customer needs. Optimize inventory, streamline operations, and make data-driven decisions for success. DataScience empowers businesses to leverage the power of data for accurate and insightful demand forecasts. sales) and independent variables (e.g.,
Datascience projects can be complex and demanding, involving numerous tasks and components. To ensure efficiency, reproducibility, and collaboration, it is essential to organize your datascience project effectively. Set Up a Project Directory: Start by creating a dedicated directory for your datascience project.
DataScience Project — Predictive Modeling on Biological Data Part III — A step-by-step guide on how to design a ML modeling pipeline with scikit-learn Functions. Photo by Unsplash Earlier we saw how to collect the data and how to perform exploratory data analysis. You can refer part-I and part-II of this article.
Data scientists have always engaged in some amount of data development. They normalize values, drop rows with missing data, and convert categorical columns into multiple boolean columns. In short, data development treats data like software—as a resource to iteratively change and improve to fit the project’s needs.
Data scientists have always engaged in some amount of data development. They normalize values, drop rows with missing data, and convert categorical columns into multiple boolean columns. In short, data development treats data like software—as a resource to iteratively change and improve to fit the project’s needs.
Data scientists have always engaged in some amount of data development. They normalize values, drop rows with missing data, and convert categorical columns into multiple boolean columns. In short, data development treats data like software—as a resource to iteratively change and improve to fit the project’s needs.
What is R in DataScience? As a programming language it provides objects, operators and functions allowing you to explore, model and visualise data. How is R Used in DataScience? R is a popular programming language and environment widely used in the field of datascience.
As AIDAs interactions with humans proliferated, a pressing need emerged to establish a coherent system for categorizing these diverse exchanges. The main reason for this categorization was to develop distinct pipelines that could more effectively address various types of requests.
Hey guys, in this blog we will see some of the most asked DataScience Interview Questions by interviewers in [year]. Datascience has become an integral part of many industries, and as a result, the demand for skilled data scientists is soaring. What is DataScience?
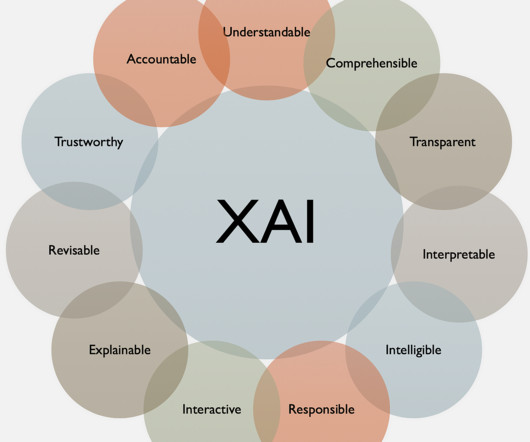
Transparency and explainability : Making sure that AI systems are transparent, explainable, and accountable. However, explaining why that decision was made requires next-level detailed reports from each affected model component of that AI system. Model risk : Risk categorization of the model version.
DataScience Project — Build a Decision Tree Model with Healthcare Data Using Decision Trees to Categorize Adverse Drug Reactions from Mild to Severe Photo by Maksim Goncharenok Decision trees are a powerful and popular machine learning technique for classification tasks.
When it comes to implementing any ML model, the most difficult question asked is how do you explain it. Suppose, you are a data scientist working closely with stakeholders or customers, even explaining the model performance and feature selection of a Deep learning model is quite a task. How can we explain it in simple terms?
studio for new foundation models, generative AI and machine learning The watsonx.data fit-for-purpose data store, built on an open lakehouse architecture The watsonx.governance toolkit, to accelerate AI workflows that are built with responsibility, transparency and explainability.
In the ever-evolving landscape of machine learning and artificial intelligence, understanding and explaining the decisions made by models have become paramount. Enter Comet , that streamlines the model development process and strongly emphasizes model interpretability and explainability. Why Does It Matter?
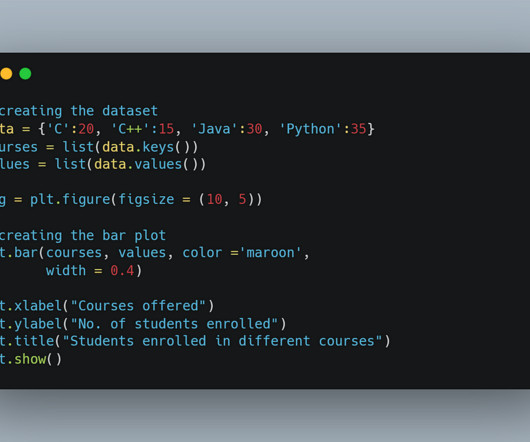
Let me explain some common components of axes: Axes with visualization components (Image by author) Title: A text that appears at the top of a plot and provides a brief description of the plot or the data it represents. The figure below explains more about the structure of axes in Matplotlib. 2] Matplotlib 3.7.0 documentation.
A high school English teacher recently explained to me how she’s coping with the latest challenge to education in America: ChatGPT. the Stanford scientists wrote in a July 2023 paper , published under the banner, “ opinion ,” in the peer-reviewed datascience journal Patterns.
207 While an AI designed for categorizing traffic lights, for example, doesn’t need perfection, medical tools must be highly accurate — any oversight could be fatal. Currently, Annalise.ai works for chest X-rays and brain CT scans, with more on the way. The AI Podcast · Harrison.ai To overcome this challenge, annalise.ai
Marketers use ML for lead generation, data analytics, online searches and search engine optimization (SEO). ML algorithms and datascience are how recommendation engines at sites like Amazon, Netflix and StitchFix make recommendations based on a user’s taste, browsing and shopping cart history.
207 While an AI designed for categorizing traffic lights, for example, doesn’t need perfection, medical tools must be highly accurate — any oversight could be fatal. Currently, Annalise.ai works for chest X-rays and brain CT scans, with more on the way. The AI Podcast · Harrison.ai To overcome this challenge, annalise.ai
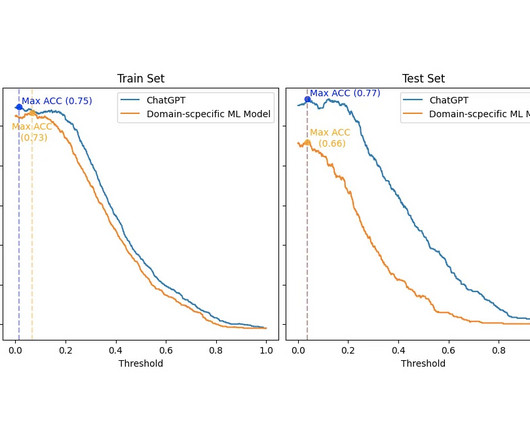
So, to make a viable comparison, I had to: Categorize the dataset scores into Positive , Neutral , or Negative labels. This evaluation assesses how the accuracy (y-axis) changes regarding the threshold (x-axis) for categorizing the numeric Gold-Standard dataset for both models. First, I must be honest. Then, I made a confusion matrix.
In this post, we show how to configure a new OAuth-based authentication feature for using Snowflake in Amazon SageMaker Data Wrangler. Snowflake is a cloud data platform that provides data solutions for data warehousing to datascience. Next, we want to look for categoricaldata in our dataset.
Evaluate the computing resources and development environment that the datascience team will need. Large projects or those involving text, images, or streaming data may need specialized infrastructure. Typical data quality checks and corrections include: Missing data or incomplete records Inconsistent data formatting (e.g.,
Why it’s challenging to process and manage unstructured data Unstructured data makes up a large proportion of the data in the enterprise that can’t be stored in a traditional relational database management systems (RDBMS). Understanding the data, categorizing it, storing it, and extracting insights from it can be challenging.
Most experts categorize it as a powerful, but narrow AI model. Self-driving cars excel at navigating roads and supercomputers like IBM Watson ® can analyze vast amounts of data. Building an in-house team with AI, deep learning , machine learning (ML) and datascience skills is a strategic move.
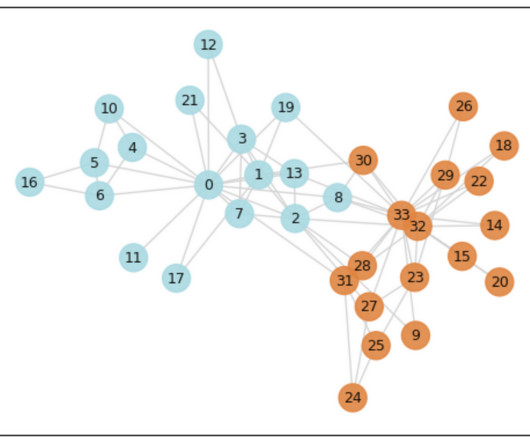
I will explain what these measures mean in plain english , so that you can at least grasp the intuition behind them. If our attribute is categorical (e.g., NetworkX will automatically detect wether your attribute is categorical or numerical and behave accordingly. Let’s go over the first one.
Contact Lens for Amazon Connect generates call and chat transcripts; derives contact summary, analytics, categorization of associate-customer interaction, and issue detection; and measures customer sentiments. Contact Lens then stores analytics data into an Amazon Simple Storage Service (Amazon S3) bucket for long-term retention.
“If we compare the relative performance of Silicon Valley’s stock to that of JP Morgan and Bank of America since 1993, its market value rose 250-fold until the market’s peak on Nov 3, 2021, relative to 11-fold for JP Morgan and three-fold for Bank of America,” Vasant explained. So how can algorithms recognize overreactions?
Even though converting raw data into actionable insights, it is not determined by ML algorithms alone. In this article, I am going to explain in detail step-by-step approaches or stages of the machine learning project lifecycle. The success of any ML project depends on a well-structured lifecycle.
The company’s H20 Driverless AI streamlines AI development and predictive analytics for professionals and citizen data scientists through open source and customized recipes. The platform makes collaborative datascience better for corporate users and simplifies predictive analytics for professional data scientists.
Making visualizations is one of the finest ways for data scientists to explaindata analysis to people outside the business. Exploratory data analysis can help you comprehend your data better, which can aid in future data preprocessing. Let’s examine some charts that can be used to display categoricaldata.
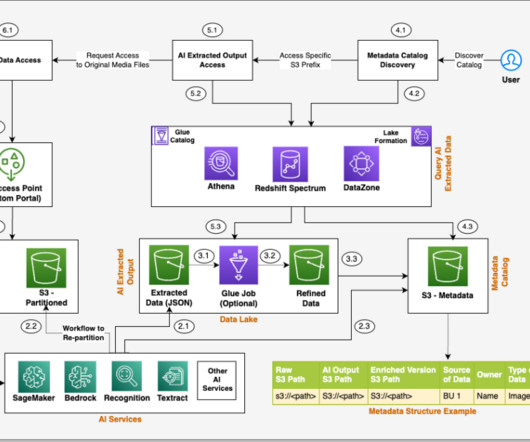
The core idea behind this phase is automating the categorization or classification using AI. Refer to this GitHub repository for a full set of Python Notebooks that explain the process step-by-step in detail. You can also get datascience training on-demand wherever you are with our Ai+ Training platform.
If you want an overview of the Machine Learning Process, it can be categorized into 3 wide buckets: Collection of Data: Collection of Relevant data is key for building a Machine learning model. It isn't easy to collect a good amount of quality data. How Machine Learning Works? Models […]
Its crucial capability is processing categoricaldata without converting it to numerical data. This means that the model can perform its function as you desire after specifying categoricaldata. We can now check our preprocessed data with Pandas to have a general overview of our data.
This blog equips you with the top interview questions and answers, categorized by difficulty level. This blog equips you with the top DBMS interview questions and answers categorized by difficulty level – Basic, Medium, and Complex – to help you shine in your next encounter. INSERT : Adds new data to a table.
Provide criteria for RFP categorization. An explainability. Adrian Boeh is a Senior Data Scientist working on advanced data tasks for Schneider Electric’s North American Customer Transformation Organization. Dan Volk is a Data Scientist at the AWS Generative AI Innovation Center. 4b] A relevance score. [4c]
DataScience techniques are always improving. I started summarizing my projects into case studies after finishing the Google Data Analytics Professional Certificate , the specialization includes 8 courses and the last course entails completing two case studies using semi-large datasets.
We organize all of the trending information in your field so you don't have to. Join 15,000+ users and stay up to date on the latest articles your peers are reading.
You know about us, now we want to get to know you!
Let's personalize your content
Let's get even more personalized
We recognize your account from another site in our network, please click 'Send Email' below to continue with verifying your account and setting a password.


Let's personalize your content