
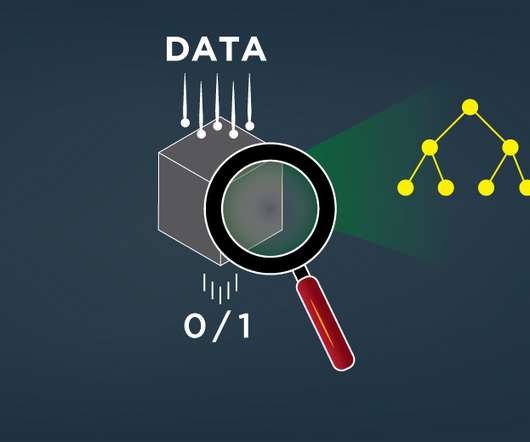
Here’s How to use Sankey Diagrams for Data Visualization
Analytics Vidhya
NOVEMBER 18, 2021
This article was published as a part of the Data Science Blogathon. Introduction to Sankey Diagram for Data Visualization Very often, we are in a situation where we would have to visualize how data flows between entities. For example, let’s take the case of how residents have migrated from one country to another within the […]. The post Here’s How to use Sankey Diagrams for Data Visualization appeared first on Analytics Vidhya.


Let's personalize your content