This site uses cookies to improve your experience. To help us insure we adhere to various privacy regulations, please select your country/region of residence. If you do not select a country, we will assume you are from the United States. Select your Cookie Settings or view our Privacy Policy and Terms of Use.
Cookie Settings
Cookies and similar technologies are used on this website for proper function of the website, for tracking performance analytics and for marketing purposes. We and some of our third-party providers may use cookie data for various purposes. Please review the cookie settings below and choose your preference.
Used for the proper function of the website
Used for monitoring website traffic and interactions
Cookie Settings
Cookies and similar technologies are used on this website for proper function of the website, for tracking performance analytics and for marketing purposes. We and some of our third-party providers may use cookie data for various purposes. Please review the cookie settings below and choose your preference.
Strictly Necessary: Used for the proper function of the website
Performance/Analytics: Used for monitoring website traffic and interactions
Key components of data security platforms Effective DSPs are built on several core components that work together to protect data from unauthorised access, misuse, and theft. Datadiscovery and classification Before data can be secured, it needs to be classified and understood. The components include: 1.
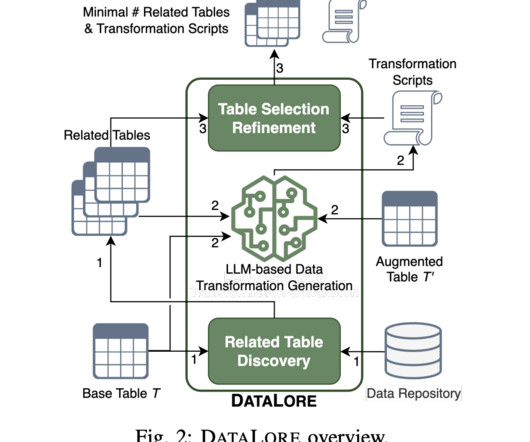
DATALORE uses Large Language Models (LLMs) to reduce semantic ambiguity and manual work as a data transformation synthesis tool. Second, for each provided base table T, the researchers use datadiscovery algorithms to find possible related candidate tables. These models have been trained on billions of lines of code.
Why it’s challenging to process and manage unstructured data Unstructured data makes up a large proportion of the data in the enterprise that can’t be stored in a traditional relational database management systems (RDBMS). Understanding the data, categorizing it, storing it, and extracting insights from it can be challenging.
Summary: Feeling overwhelmed by your data? Data classification is the key to organization and security. This blog explores what data classification is, its benefits, and different approaches to categorize your information. Discover how to protect sensitive data, ensure compliance, and streamline data management.
For each summary presented to the clinical expert, they were asked to categorize it as either good, acceptable, or bad. The evaluation questions also collected feedback on the number of hallucinations and inaccurate or not helpful information.
Bar Charts Categoricaldata, like eye colour or customer preference for a product brand, thrives with bar charts. These charts visually represent each category’s frequency or proportion of data points. However, use colour judiciously, considering colour blindness and ensuring colour choices effectively represent the data.
Median: The middle value in a dataset, helping to understand the data’s distribution. Mode: The most frequent value, useful in categoricaldata. Applications Descriptive Data Analysis is widely used in business reporting and dashboards. Clustering: Grouping similar data points to identify segments within the data.
The ELT architecture and its type differ from organization to organization as they have different sets of tech stack, data sources, and business requirements. ETL pipelines can be categorized based on the type of data being processed and how it is being processed. What are the different types of ETL pipelines in ML?
IBM Watson Analytics IBM AI-driven insights are used by Watson Analytics, a cloud-based data analysis and visualization tool, to assist users in understanding their data. Users can rapidly find trends, patterns, and relationships in data using its automatic datadiscovery tool.
IBM Watson Analytics IBM AI-driven insights are used by Watson Analytics, a cloud-based data analysis and visualization tool, to assist users in understanding their data. Users can rapidly find trends, patterns, and relationships in data using its automatic datadiscovery tool.
We organize all of the trending information in your field so you don't have to. Join 15,000+ users and stay up to date on the latest articles your peers are reading.
You know about us, now we want to get to know you!
Let's personalize your content
Let's get even more personalized
We recognize your account from another site in our network, please click 'Send Email' below to continue with verifying your account and setting a password.


Let's personalize your content